Telemetry for Elixir applications built with Commanded
Learn how to produce and report on telemetry metrics for your Elixir application.
Elixir Commanded
Telemetry is a relatively new library designed to dynamically dispatch metrics and instrumentation. It is lightweight, small and can be used to instrument any Erlang or Elixir project. You can watch Arkadiusz Gil’s recent talk on Telemetry …and metrics for all from ElixirConf EU 2019.
The Elixir example from the library’s documentation demonstrates how easy it is to add telemetry to existing code, in this case logging an incoming HTTP request to a controller:
:telemetry.execute(
  [:web, :request, :done],
  %{latency: latency},
  %{request_path: path, status_code: status}
)
For applications implementing command query responsibility segregation and event sourcing (CQRS/ES) we have two common locations to produce useful metrics: commands being dispatched and recorded domain events. As these are named using domain specific terminology, we gain useful insights into what our application is doing at runtime when instrumented using telemetry.
Command telemetry
Commanded provides command dispatch middleware as an extension point to include concerns, such as telemetry, to every command dispatch. The example middleware shown below instruments each dispatched command along with its outcome – as success or failure – and execution duration.
defmodule Commanded.Middleware.Telemetry do
  @moduledoc """
  A Commanded middleware to instrument the command dispatch pipeline with
  `:telemetry` events.

  It produces the following three events:

    - `[:commanded, :command, :dispatch, :start]`
    - `[:commanded, :command, :dispatch, :success]`
    - `[:commanded, :command, :dispatch, :failure]`
  """

  @behaviour Commanded.Middleware

  alias Commanded.Middleware.Pipeline
  import Pipeline

  def before_dispatch(%Pipeline{} = pipeline) do
    %Pipeline{command: command, metadata: metadata} = pipeline

    :telemetry.execute(
      [:commanded, :command, :dispatch, :start],
      %{time: System.system_time()},
      %{command: command, metadata: metadata}
    )

    assign(pipeline, :start_time, monotonic_time())
  end

  def after_dispatch(%Pipeline{} = pipeline) do
    %Pipeline{command: command, metadata: metadata} = pipeline

    :telemetry.execute(
      [:commanded, :command, :dispatch, :success],
      %{duration: duration(pipeline)},
      %{command: command, metadata: metadata}
    )

    pipeline
  end

  def after_failure(%Pipeline{} = pipeline) do
    %Pipeline{command: command, metadata: metadata} = pipeline

    :telemetry.execute(
      [:commanded, :command, :dispatch, :failure],
      %{duration: duration(pipeline)},
      %{command: command, metadata: metadata}
    )

    pipeline
  end

  # Calculate the duration, in microseconds, between start time and now.
  defp duration(%Pipeline{assigns: %{start_time: start_time}}) do
    monotonic_time() - start_time
  end

  defp duration(%Pipeline{}), do: nil

  defp monotonic_time, do: System.monotonic_time(:microsecond)
end
Usage
To use the telemetry middleware module above it must be registered as a middleware in your app’s router:
defmodule MyApp.Router do
  use Commanded.Commands.Router

  alias Commanded.Middleware.Telemetry

  middleware(Telemetry)
end
Once registered, telemetry events will be produced for all dispatched commands.
Event telemetry
For event telemetry we can use a Commanded event handler. An event handler is a GenServer module with a handle/2 callback function which gets executed for every recorded domain event, perfect for producing event metrics.
defmodule Commanded.EventTelemetry do
  @moduledoc """
  A Commanded event handler to produce `:telemetry` events for each recorded
  event.

  It produces the following event:

    - `[:commanded, :event, :published]`

  """

  use Commanded.Event.Handler, name: __MODULE__, start_from: :current

  def handle(event, metadata) do
    :telemetry.execute(
      [:commanded, :event, :published],
      %{timestamp: Map.get(metadata, :created_at)},
      %{event: event, metadata: metadata}
    )
  end
end
Usage
The event handler is a GenServer process so must be included somewhere in your application’s supervision tree:
defmodule MyApp do
  use Application

  def start(type, args) do
    children = [
      Commanded.EventTelemetry,
      # ..
    ]

    Supervisor.start_link(children, strategy: :one_for_one)
  end
end
Once started the handler will receive each recorded event in real-time, producing telemetry events.
Reporting metrics
So far we’ve only been producing telemetry events, now we need to report those measurements to our preferred monitoring service. The telemetry library allows you to attach a callback function to one or more events. This function gets called each time a metric is executed.
The example reporter module below shows how to attach a module callback function (Reporter.handle_event/4) to the four events we produce. It’s just logging the metrics using the built-in Elixir Logger, but in a real application you’d push these metrics to a monitoring service, such as AWS CloudWatch, Datadog, or any other local or hosted service.
defmodule Commanded.Reporter do
  require Logger

  alias Commanded.Reporter

  def setup do
    events = [
      [:commanded, :command, :dispatch, :start],
      [:commanded, :command, :dispatch, :success],
      [:commanded, :command, :dispatch, :failure],
      [:commanded, :event, :published]
    ]

    :telemetry.attach_many(
      "commanded-reporter",
      events,
      &Reporter.handle_event/4,
      nil
    )
  end

  def handle_event([:commanded, :command, :dispatch, :start], measurements, metadata, nil) do
    %{command: command} = metadata

    Logger.info(fn -> "Command #{inspect(command.__struct__)} dispatched" end)
  end

  def handle_event([:commanded, :command, :dispatch, :success], measurements, metadata, nil) do
    %{duration: duration} = measurements
    %{command: command} = metadata

    Logger.info(fn ->
      "Command #{inspect(command.__struct__)} succeeded in " <> inspect(duration) <> "μs"
    end)
  end

  def handle_event([:commanded, :command, :dispatch, :failure], measurements, metadata, nil) do
    %{command: command} = metadata

    Logger.info(fn -> "Command #{inspect(command.__struct__)} failed" end)
  end

  def handle_event([:commanded, :event, :published], measurements, metadata, nil) do
    %{timestamp: timestamp} = measurements
    %{event: event} = metadata

    Logger.info(fn -> "Event #{inspect(event.__struct__)} published at " <> inspect(timestamp) end)
  end
end
It’s worth noting that executing the callback function happens in the context of the process calling Telemetry.execute. You might want to delegate any reporting work to some other process so as to not block or affect the calling process.
Collecting periodic metrics
The telemetry_poller library allows you to periodically collect measurements and dispatch them as Telemetry events. This can be used to record measurements such as VM stats (memory usage, queue length) and application-specific concerns (registered user count, online users, etc.).
Wrap up
How can you use this information once you’ve added telemetry to your app?
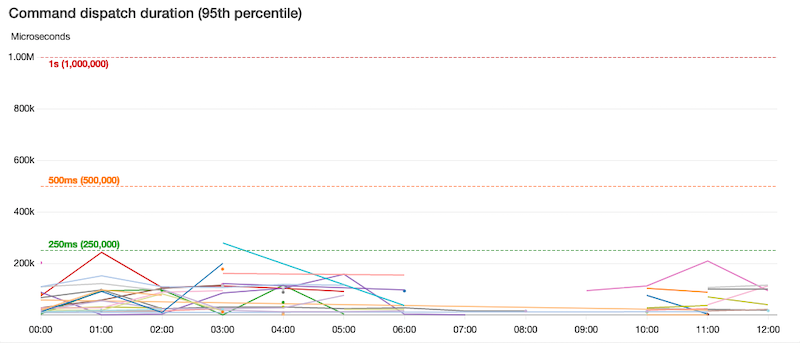
We’re using AWS CloudWatch to monitor and visualise the metrics produced by the in-app telemetry in one Elixir application I’m working with. Using telemetry metrics we observe application behaviour such as the commands being dispatch, recorded events, Erlang VM stats, and background job queue size. We monitor command dispatch duration and failures to create alerts which notify us before they breach SLAs. This helps us to anticipate potential issues before they affect end users.
The graph below is one example where the 95th percentile command dispatch duration is monitored to ensure it stays within acceptable bounds.

If you’ve built an Elixir application using Commanded you can include these command dispatch middleware and event handler modules to start producing useful metrics today.